
Stop guessing how your maintenance costs stack up. The Property Maintenance Index compiles data from 100,000's of real jobs across plumbing, electrical, appliances, and more. Compare your expenses to industry benchmarks, demonstrate your competitive edge to landlords, and stay proactive with seasonal tips and insights.
Live cost benchmarks from thousands of jobs across Australia - so every decision you make is backed by the market, not a guess.
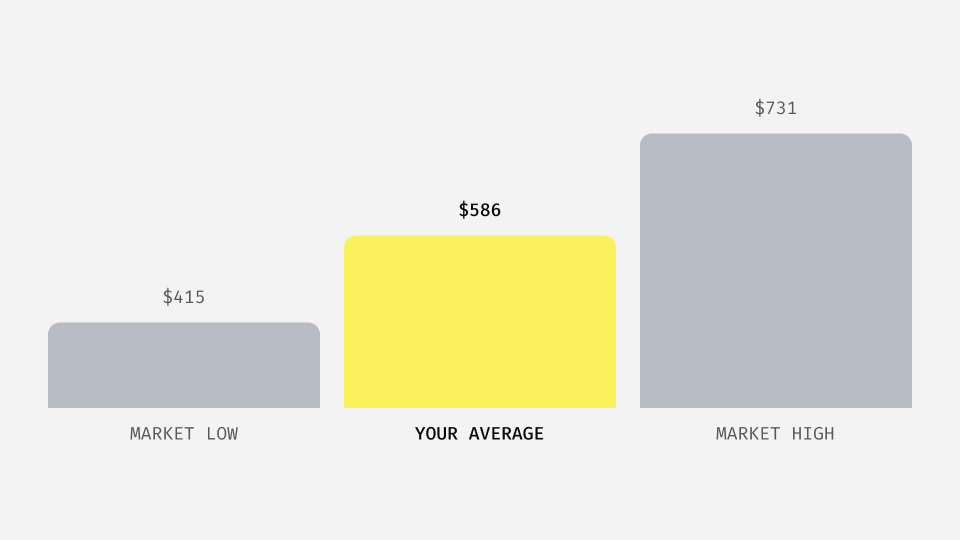
Quickly benchmark costs and identify savings.
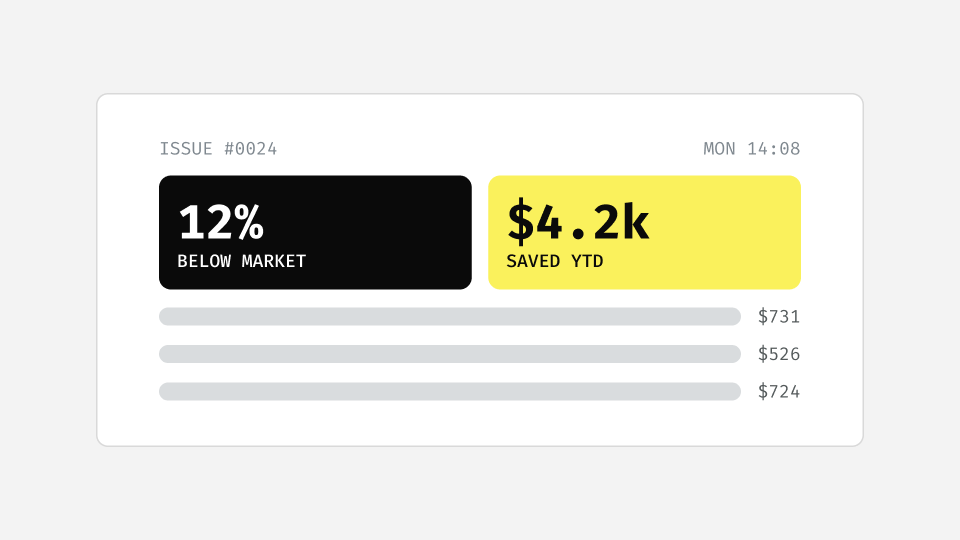
Showcase your value with real data
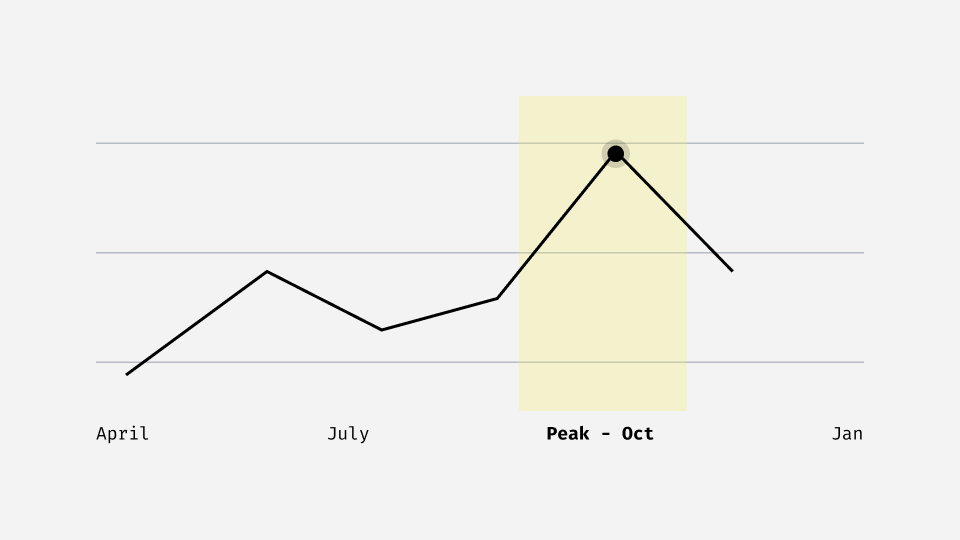
Get ahead of seasonal spikes
See where costs are heading - before they hit.
Every quarter, we track average repair costs across four maintenance categories: plumbing, appliances, structural, and electrical. Watch costs climb, stabilise, or shift, and use that context to brief owners, plan budgets, and get ahead of the market.

Know the cost of every job - down to the part.
It's not enough to know plumbing is expensive. You need to know whether it's the tap, the drain, or the waste disposal. The PMI breaks every category down to job level with real cost ranges so you can benchmark quotes, spot overpricing, and advise owners with confidence.

